Collect Activity Log
How to collect a Control D Activity Log and help support solve your issue.
Support probably linked you to this page in order to collect an Activity Log so we can troubleshoot an issue. Please follow the below instructions exactly.
Step 1 - Prepare
Navigate to the Devices screen and select the Analytics button on the Endpoint you wish to troubleshoot. Select 'Full Analytics'. The Activity Log for your endpoint will be unavailable unless you complete this step.
Fully close the the affected service or app. If possible, clear any local state.
Important: if these steps are not possible or not available, please move to step 2.
- Android Phone: Long press the app icon, go to App Info → Storage → Clear Cache
- Browser based: Open Incognito/Private tab
- iPhone: Go to Settings → Storage → Internal Storage → Cached data → Clear (more detailed steps here)
- Additionally, fully close all non-relevant apps on the same endpoint. This helps isolate the activity we're looking for.
Step 2 - Start Log
Navigate to the the Activity Log and select, in the dropdown at the top, the Endpoint that is configured on your phone, TV box, browser or computer that you're using to reproduce the issue.
Next, click the Clear Filters button to ensure that you're not filtering the data. It is very important that support see all queries made during the reproduction of the issue.
Note: You can collect an Activity Log from any endpoint that is using Control D, even if you are not using that endpoint to access the Control D website. To collect logs from a endpoint other than the one you are using to view the website, simply click on the endpoint name in the dropdown at the top of the Activity Log screen.

Step 3 - Reproduce Issue
Start the app or navigate to the website in the Incognito/Private tab, login and reproduce the problem. As soon as the issue is reproduced/error occurs, note down the time.
Step 4 - Collect and Send
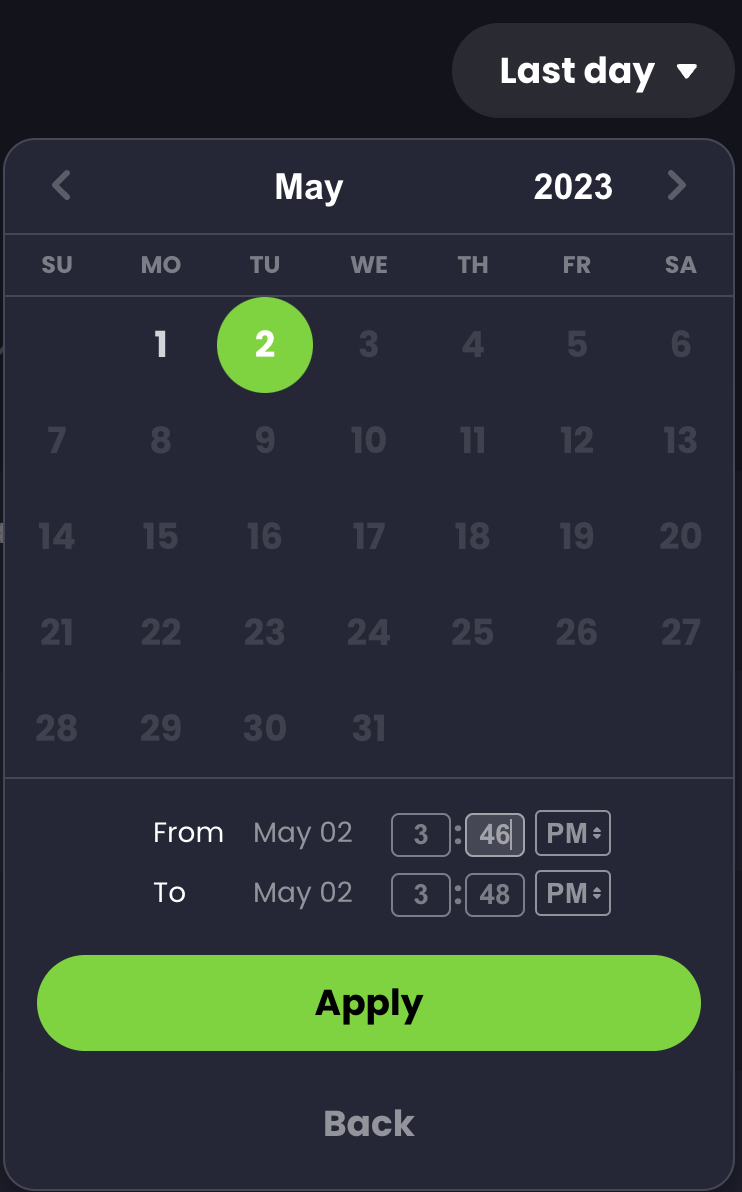
Using the dropdown at the top right of the Activity Log page (it might say "Last day" or "Last hour") select Custom, and select a time range beginning one minute before and ending one minute after he time that you noted in the above step.

Copy the Activity Log using the button at the top right of the Activity Log screen (just to the right of the search box) and provide it to support. Additionally, take a screenshot of the error and send it along with the Activity Log, and provide the exact endpoint/platform you're using to reproduce the issue.
Updated 6 months ago