
Activity Log
View historically made or real time DNS queries with additional metadata.
What is Activity Log
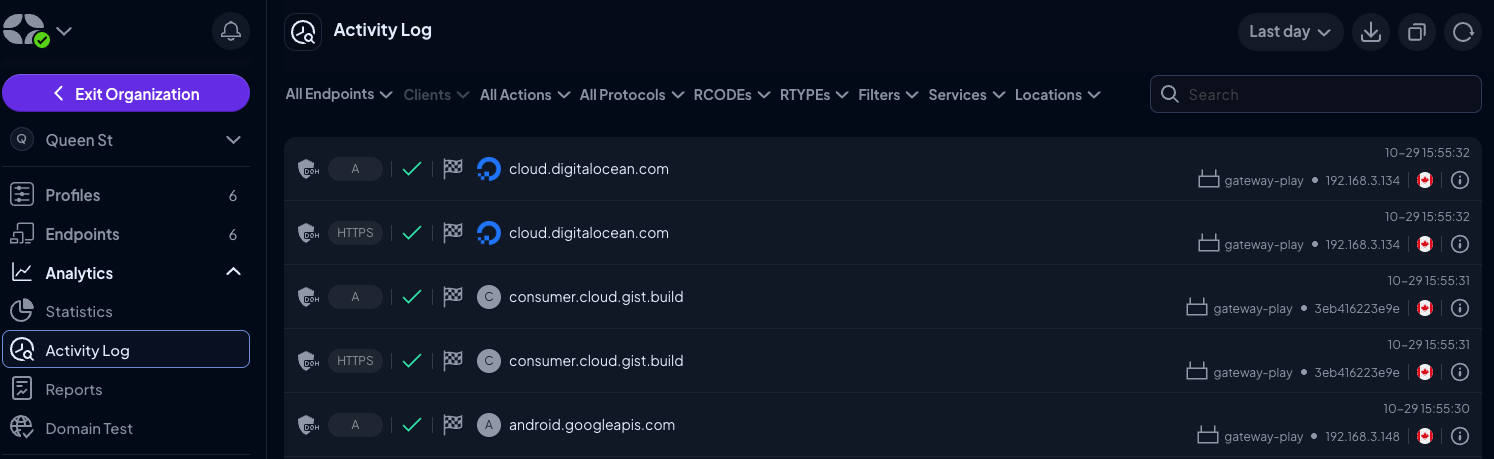
This section allows you to view all DNS queries that were made historically, as well as view them in real time.
How to Use It
Full AnalyticsIn order to see DNS queries in the Activity Log, you need to enable "Full" Analytics log level.
Simply navigate to the Analytics -> Activity Log section, and choose an Endpoint you wish to monitor. From here, you can filter the data in multiple ways:
- Date - choose the date and time to view queries from the chosen time period
- Endpoints - choose which Endpoint's data to view
- Clients (only available when an Endpoint is chosen) - choose which Client's query to view
- Actions - show queries based on a performed action (block, bypass, redirect)
- Protocols - show queries that used specific DNS protocols (Legacy, DNS-over-HTTPS, etc)
- RCODEs - show queries that resulted in a particular return code
- RTYPEs - show queries that resulted in a particular return type
- Filters - show queries that were blocked by a specific Filter
- Services - show queries that were acted upon by a specific Service
- Locations - show queries that were redirected to a specific location
Real Time Logging
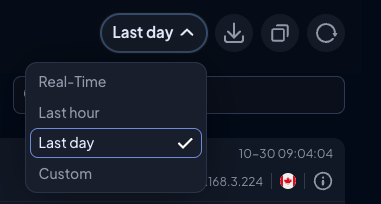
You can select Real-Time from the date selection dropdown to see DNS queries that are being made on a chosen Endpoint in real time.
Real-Time FilteringIn real-time mode, changing any filter - including the search field - starts a new real-time logging session. This clears the logs currently on screen, because the system only streams new DNS queries that match the updated filters. If you remove the search, you’ll see an empty list until new matching queries arrive. This is by design to improve performance in the browser.
If you need to search past/older queries, switch to historical activity instead.
Exporting Logs
If you've been asked by Control D Support to send Activity Logs or would like to export your logs for any other reason, there are two methods of doing so.
Copy to Clipboard
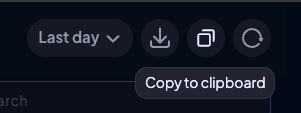
At the top right of the log list you'll see this copy button. Click it to copy all the currently collected log results to your clipboard.
Export Logs
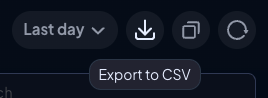
The button to the left of the copy button will export and download the currently collected logs in a convenient .csv format.
Updated 9 months ago