
Filter Preview
See what a Filter change would have done to your recorded traffic before you apply it.
TLDRFilter Preview shows what blocking, unblocking, or changing the mode of a Filter would have done to your recent DNS traffic. Review the affected domains, add Custom Rules for the ones you want to keep working, then apply the change. Nothing changes until you click the apply button.
What is Filter Preview?
Turning on a Filter can block domains that your users or devices depend on. Filter Preview lets you check this first.
Filter Preview takes a Filter change and replays it against the DNS queries your Endpoints have already recorded. It then shows:
- How many queries would have been blocked (or allowed) with that change.
- The share of the profile's traffic those queries represent.
- Which domains would have been affected, and how many queries each one had.
- How those queries were spread over time.
From the same window, you can add a Custom Rule for any affected domain, then apply the Filter change.
Requirements
Filter Preview uses recorded traffic, so it needs Analytics:
- Only traffic from Endpoints with Full Analytics is counted. Endpoints set to Some Analytics or No Analytics are not included. See Analytics.
- A new profile, or one with no recorded traffic, still shows the Preview button. The preview then tells you why there is nothing to check yet (for example, "No endpoints yet" or "No analytics yet").
The Preview button only appears on Filters that support preview. Most Native and 3rd Party Filters support it. The Malware Filter does not.
Open a Preview
- Go to Profiles and open the profile you want to change.
- Open the Filters tab.
- On the Filter card, click the Preview icon next to the info icon. The tooltip shows the change it will preview, for example Preview: Block Gambling.
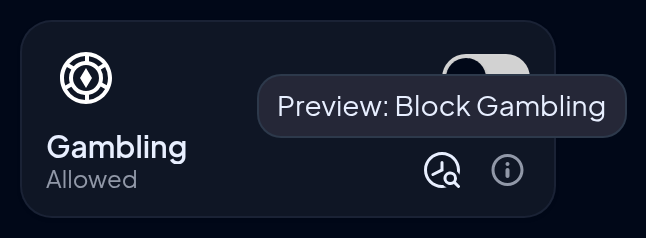
The direction of the preview follows the Filter's current state:
- If the Filter is off, the preview shows what turning it on would have blocked.
- If the Filter is on, the preview shows what turning it off would have allowed.
The heading names the change and the profile, for example Preview: Block Gambling, followed by the profile name and All endpoints enforcing this profile. A Shared profile shows a Shared label.
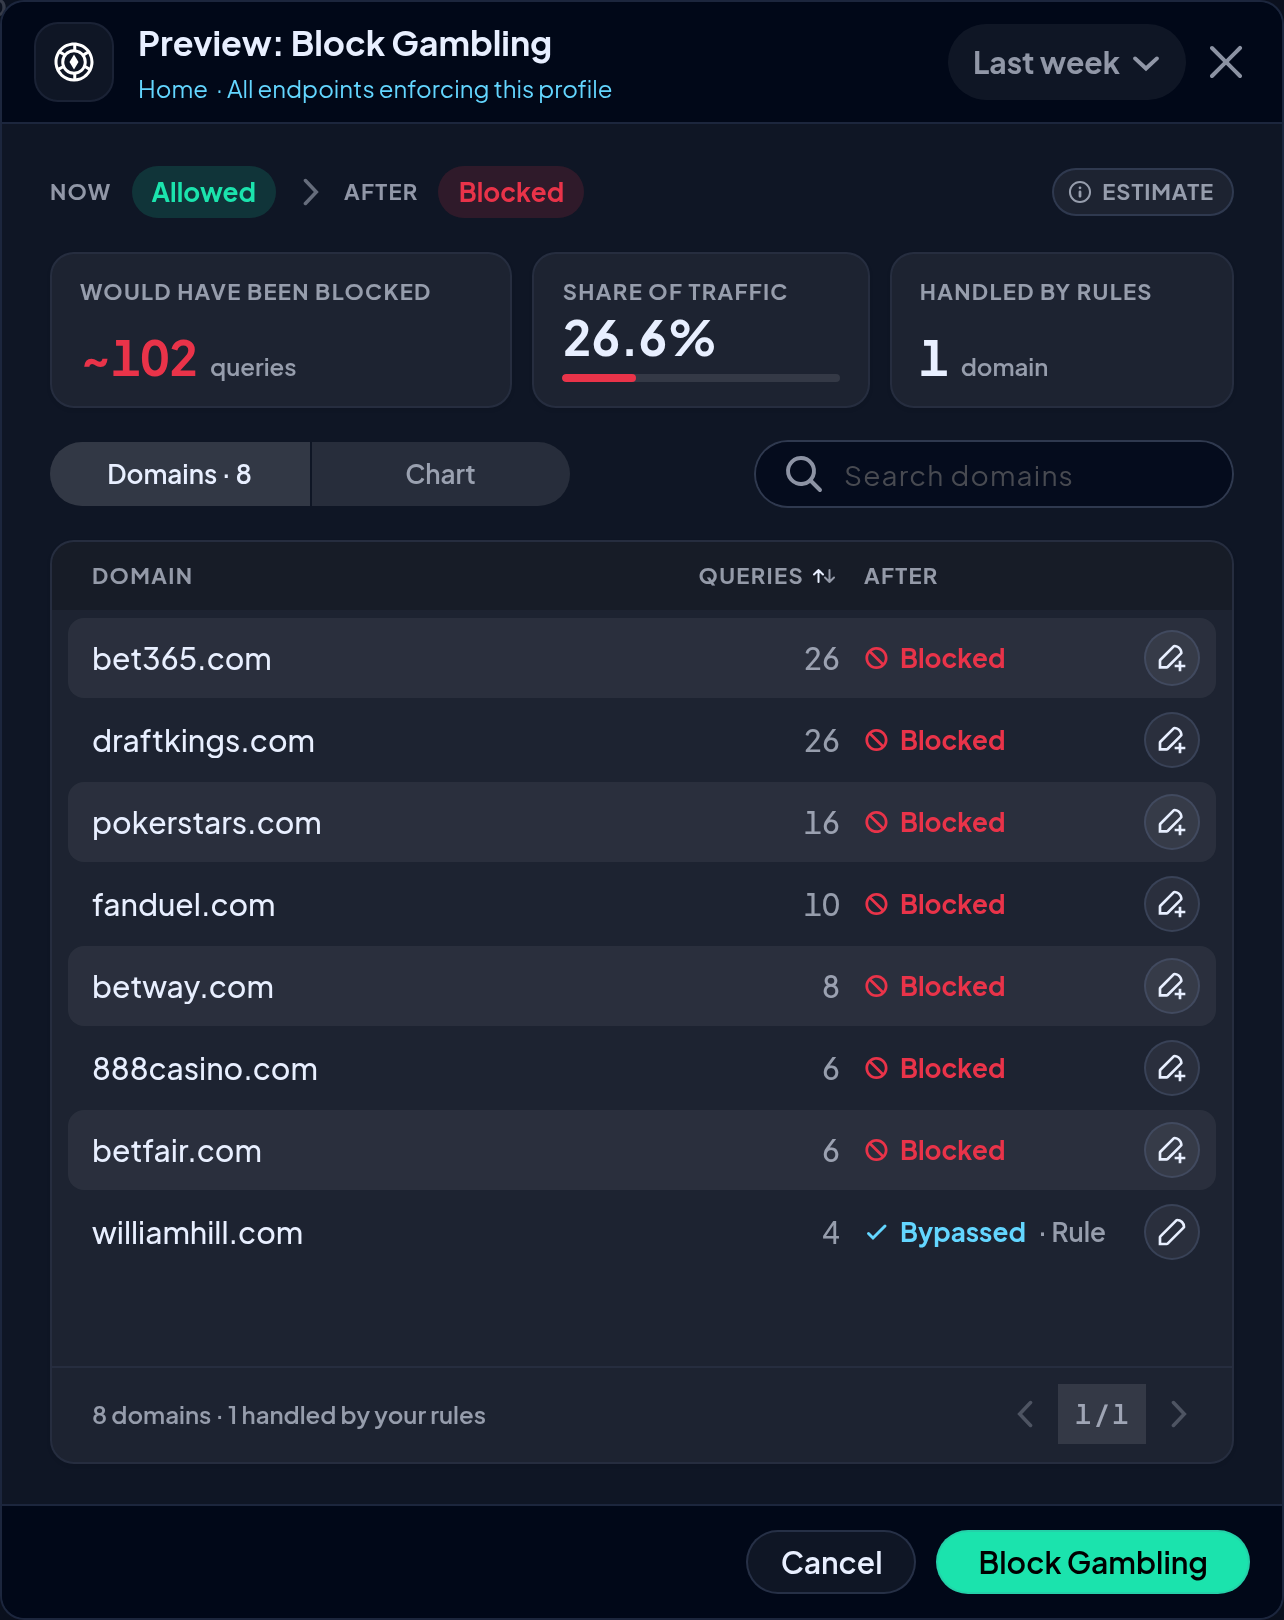
Read the Preview
Filter Mode
Filters with more than one mode (for example, Ads & Trackers) show a FILTER MODE control at the top. Pick a mode to preview it:
- For a Filter that is off, pick the mode you want to turn it on with.
- For a Filter that is on, pick Off to preview turning it off, or another mode to preview switching to it. Stricter modes show what would have been blocked. Looser modes show what would have been allowed.
If you pick the mode the Filter already uses, the preview shows No change selected.
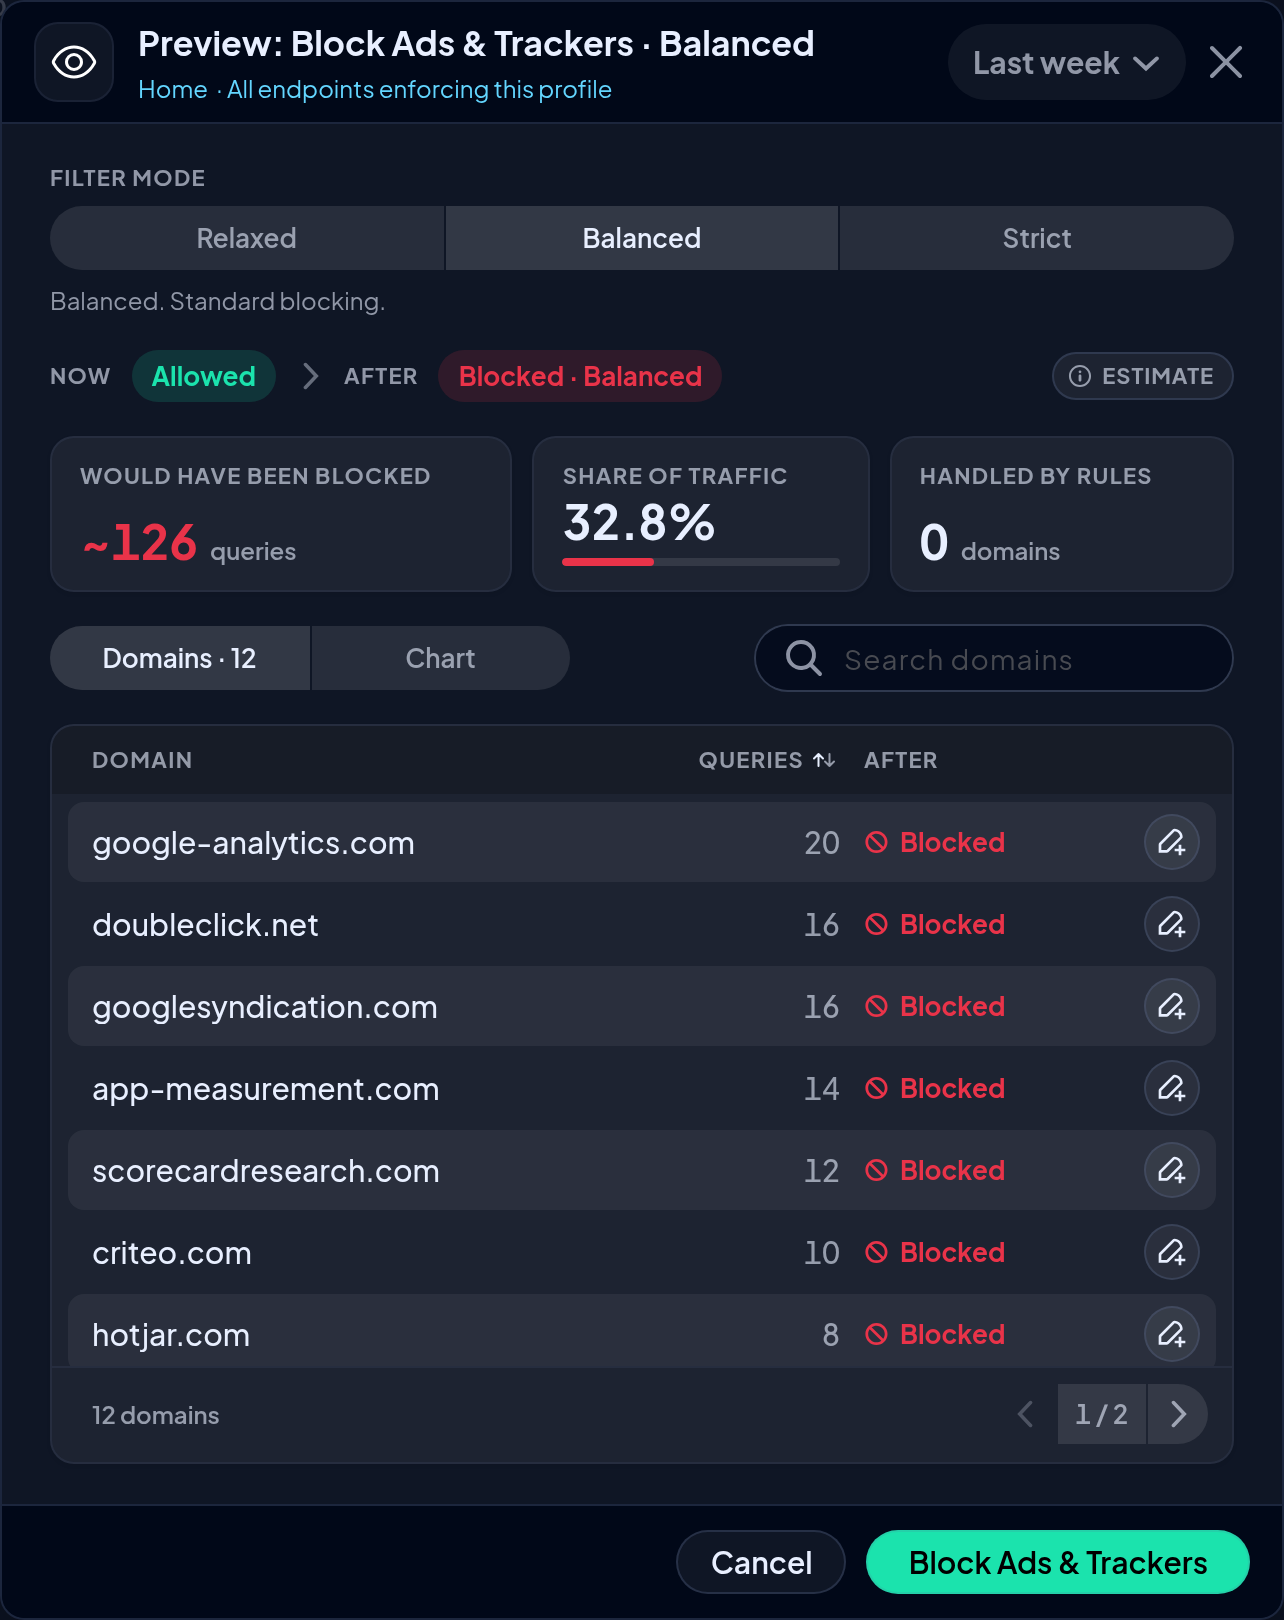
Time range
Use the time range selector in the top right corner to choose the window to check: Last day, Last week (default), or Last month.
Now and After
The NOW and AFTER labels show what the Filter does on this profile today, and what it will do once you apply the change. For example, Allowed → Blocked · Balanced.
Summary figures
| Figure | What it shows |
|---|---|
| Would have been blocked / Would have been allowed | The number of recorded queries in the selected window that would have had a different result with this change. |
| Share of traffic | Those queries as a percentage of all queries recorded for this profile in the selected window. |
| Handled by rules | How many of the affected domains already have a Custom Rule. A Custom Rule takes priority over a Filter, so the change will not affect these domains. |
Queries that your Custom Rules and Services already handle are left out of the counts.
Estimate
The figures are estimates, and are shown with a ~. Hover over the ESTIMATE badge for details. The figures are approximate because:
- The preview checks today's Filter list against your past traffic. Filter lists change daily.
- Only Endpoints with Full Analytics are counted. The real number may be higher.
When you preview turning a Filter off, another enabled Filter may still block some of the queries shown.
NoteThe numbers show what would have happened in the selected window with the change. They are not a forecast.
Domains
The Domains tab lists the domains whose result would change, with the number of queries for each. You can:
- Search for a domain.
- Sort by query count.
- Move between pages of results.
The AFTER column shows the result for each domain after the change: Blocked or Allowed. If the domain already has a Custom Rule, the column shows the rule's result (Blocked, Bypassed, or Redirected) and marks it as a Rule, because the rule takes priority over the Filter.
The domain list is limited in size. If more domains are affected, the total is shown with a + (for example, 100+).
Chart
The Chart tab shows the affected queries over time. The line is red when previewing a block and green when previewing an unblock.
Add a Custom Rule from the Preview
Use this to keep a domain working when you block a Filter, or to keep a domain blocked when you unblock one.
- On the Domains tab, click the add rule button at the end of the domain row.
- Check the DOMAIN field. You can edit it, for example to write the rule for a parent domain so that it also covers its subdomains.
- Choose the ACTION:
- Block - Queries to this domain fail, so it won't load.
- Bypass - This domain always loads, even when a Filter or Service would block it.
- Redirect - Queries are sent through a proxy location you choose. Click the destination field to choose the location.
- Click Add rule.
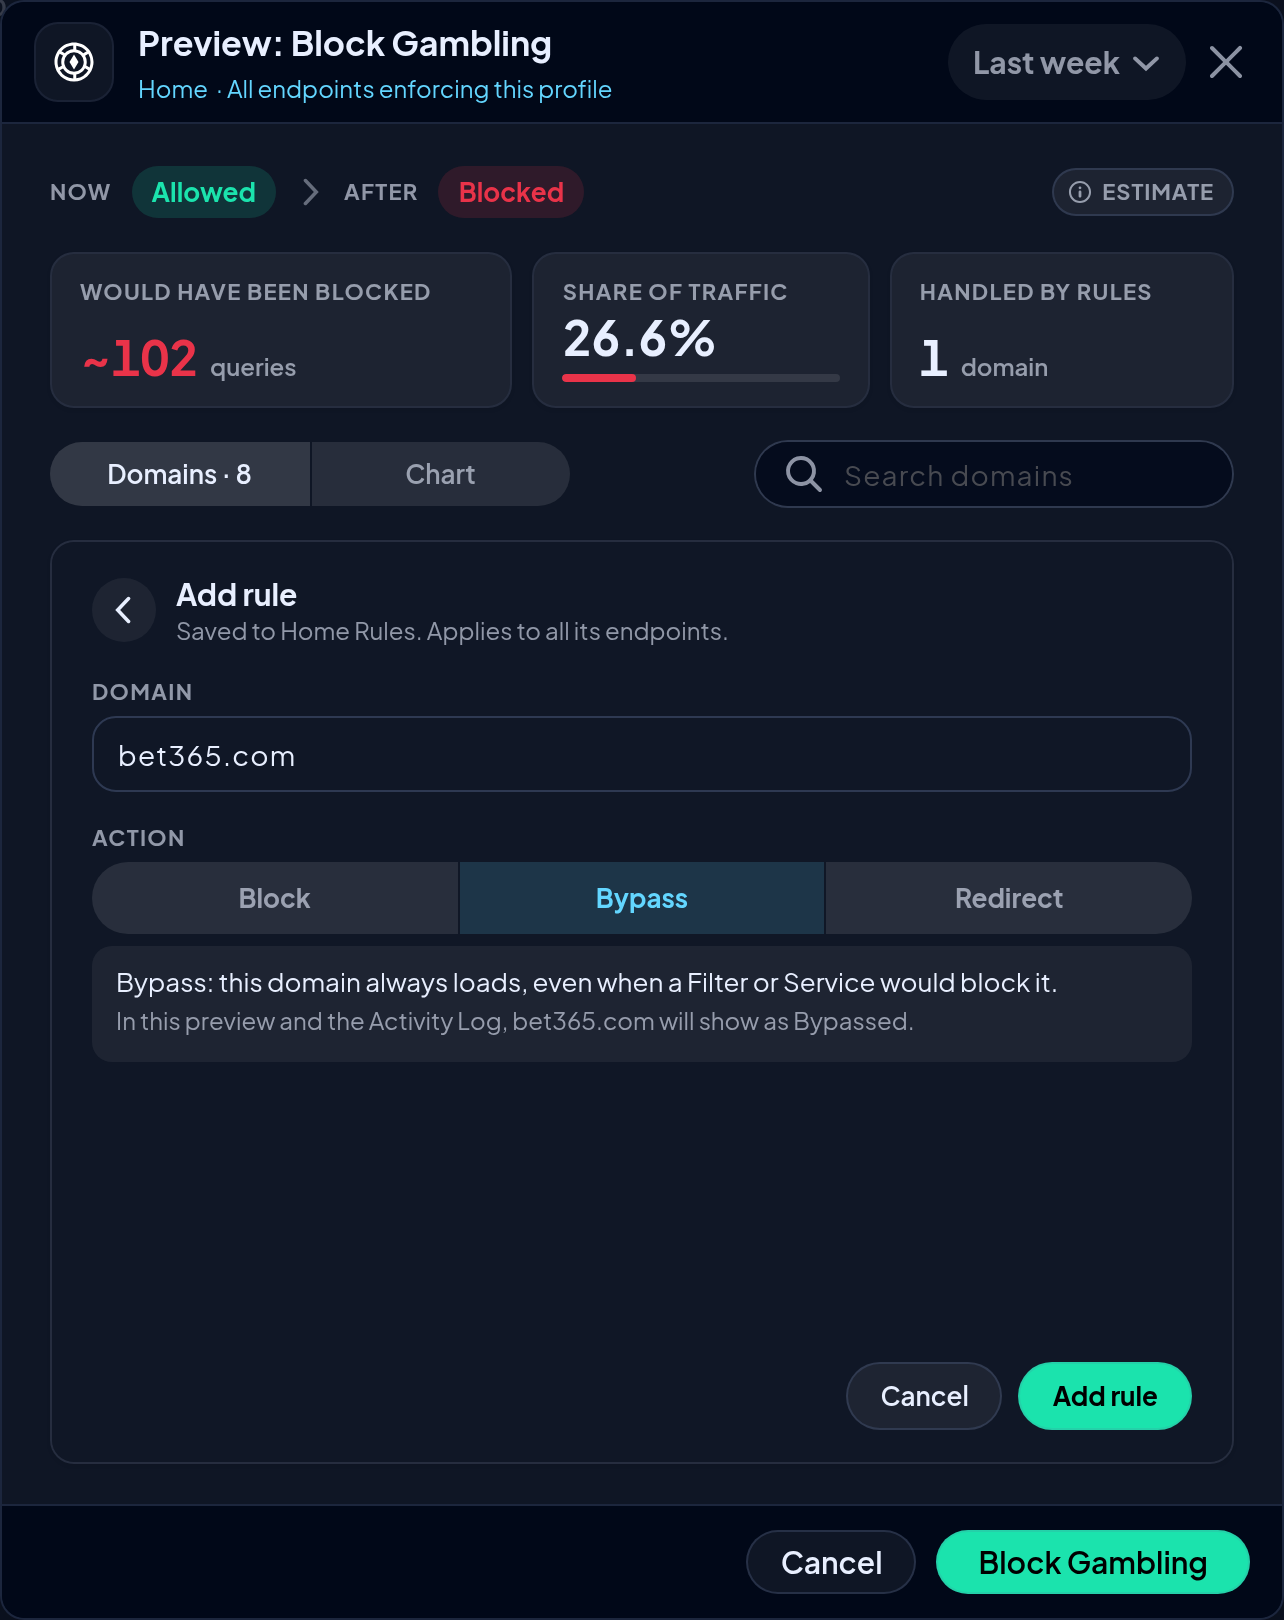
The rule is saved to the profile's Custom Rules right away and applies to all Endpoints using the profile. The domain row updates to show the rule.
To change or remove an existing rule, click the edit button on its row. If the rule is in a folder that sets the action for its rules, you can only remove it from the preview. Change it on the Custom Rules page instead.
Apply the Change
When you are ready, click the button in the bottom right corner. It names the change, for example Block Gambling, Unblock Gambling, or Switch to Strict. The change applies to all Endpoints using the profile.
Click Cancel to close the preview without changing the Filter. Custom Rules that you already saved from the preview stay saved.
Organizations
Shared profiles and Sub-Organizations
On a parent Organization, Filter Preview includes traffic from the parent and its Sub-Organizations. A change to a profile that the parent shares affects every Sub-Organization that uses it, so the preview always counts their traffic. This does not depend on the Include Sub-Organizations setting on the Statistics page.
If a Shared profile is only used by Sub-Organization Endpoints that have no recorded traffic yet, the preview shows No analytics yet.
Analytics Storage Regions
On a parent Organization, the preview only counts Sub-Organizations that store Analytics in the same Analytics Storage Region as the parent. The preview shows a note with the region it covers, for example: Includes Sub-Organizations in the New York Analytics storage region only. Sub-Organizations in other regions are not counted.
Troubleshooting
| Message | What it means |
|---|---|
| No endpoints yet | There are no Endpoints in this account. Add an Endpoint with Full Analytics to see what the Filter would do. |
| No analytics yet | None of your Endpoints have Full Analytics on, or (for a Shared profile) the Sub-Organization Endpoints using it have no recorded traffic yet. |
| No recorded traffic | The profile has no recorded queries in the selected window. Try a longer time range. |
| No impacted domains | Nothing in the selected window would have changed with this Filter change. |
| No change selected | The selected mode is the one the Filter already uses. Pick another mode. |
| Preview is busy | The preview service is busy. Wait a moment, then click retry. |
Updated 41 minutes ago